Shard Your Locks in Go: What Happens to Tail Latency
After I published the Go version of the sharded cache benchmark, a reader asked a question on X:
Nice topic. Sharding by key hash is often the cheapest win before reaching for sync.Map. Curious how shard count affected tail latency in your runs, since too many shards can hurt cache locality.
It is a good question that I could not answer because every number in that post is the total time divided by the number of operations. As a number like that says nothing about the slowest operations, I timed every single operation and ran the sharded cache with 1 to 16384 shards. The shard count turned out to matter much more for the slowest operations than for the mean. Cache locality made no difference that I could measure until 16384 shards, where the mean went up by about 5 percent.
Throughput and latency Link to heading
The throughput post reports nanoseconds per operation. I computed that number by starting a clock, running 8 goroutines until they had performed 8 million operations between them and dividing the elapsed time by 8 million. That number tells me how much work the whole cache can do per second but it does not say how long one caller waits.
With 8 goroutines running at the same time, 41 ns per operation on the throughput scale means that each goroutine spends about 8 times that, or 330 ns, on each of its own operations, which is still only an average. A cache with an average of 330 ns can have a thousand operations in every million that take 50 µs each, which is 150 times the average, although those thousand operations add only 50 ns to the average. If a web request touches the cache a hundred times, about one request in ten has one of those slow operations in it, which is why people who run servers look at percentiles instead of averages.
A percentile is a value from the sorted list of all measurements. The 50th percentile, or p50, is the median, so half of the operations were faster than it. The p99 is the value that 99 percent of the operations stayed under and 1 percent exceeded. The p99.9 is the value that one operation in a thousand exceeded and the p99.99 is the value that one operation in ten thousand exceeded. The high percentiles are called the tail because that is where they sit when you draw the distribution. Lock contention shows up in the tail because a goroutine that takes an uncontended lock pays a few nanoseconds, while a goroutine that finds the lock taken has to wait and pays much more. As this only happens to some operations, the median does not see it.
Timing every operation Link to heading
The cache is the one from the throughput post, with a Cache type that is generic over the lock type, shards that are padded to a cache line and a shardOf() method that hashes the key with hash/maphash and masks the hash to pick a shard. The Get() and Put() methods lock the shard, touch the map and unlock it with defer. I removed the useDefer constant, so the Get() method always uses defer. The parts that changed are the worker() function and the way the results are reported.
package main

import (
	"fmt"
	"hash/maphash"
	"math/rand/v2"
	"os"
	"runtime"
	"slices"
	"strconv"
	"sync"
	"sync/atomic"
	"time"
)

const (
	nKeys    = 1_000_000
	totalOps = 8_000_000
	padBytes = 112
)

var seed = maphash.MakeSeed()

type Locker interface {
	LockRead()
	UnlockRead()
	LockWrite()
	UnlockWrite()
}

type MutexLock struct{ mu sync.Mutex }

func (l *MutexLock) LockRead()    { l.mu.Lock() }
func (l *MutexLock) UnlockRead()  { l.mu.Unlock() }
func (l *MutexLock) LockWrite()   { l.mu.Lock() }
func (l *MutexLock) UnlockWrite() { l.mu.Unlock() }

type RwLock struct{ mu sync.RWMutex }

func (l *RwLock) LockRead()    { l.mu.RLock() }
func (l *RwLock) UnlockRead()  { l.mu.RUnlock() }
func (l *RwLock) LockWrite()   { l.mu.Lock() }
func (l *RwLock) UnlockWrite() { l.mu.Unlock() }

type shard[L any] struct {
	lock L
	m    map[string]string
	_    [padBytes]byte
}

type Cache[L any, PL interface {
	*L
	Locker
}] struct {
	shards []shard[L]
	mask   uint64
}

func NewCache[L any, PL interface {
	*L
	Locker
}](n int) *Cache[L, PL] {
	if n&(n-1) != 0 {
		panic("shards must be a power of two")
	}
	c := &Cache[L, PL]{shards: make([]shard[L], n), mask: uint64(n - 1)}
	for i := range c.shards {
		c.shards[i].m = make(map[string]string, nKeys/n)
	}
	return c
}

func (c *Cache[L, PL]) shardOf(key string) *shard[L] {
	if len(c.shards) == 1 {
		return &c.shards[0]
	}
	return &c.shards[maphash.String(seed, key)&c.mask]
}

func (c *Cache[L, PL]) Get(key string) (string, bool) {
	s := c.shardOf(key)
	PL(&s.lock).LockRead()
	defer PL(&s.lock).UnlockRead()
	v, ok := s.m[key]
	return v, ok
}

func (c *Cache[L, PL]) Put(key, value string) {
	s := c.shardOf(key)
	PL(&s.lock).LockWrite()
	defer PL(&s.lock).UnlockWrite()
	s.m[key] = value
}

type cache interface {
	Get(key string) (string, bool)
	Put(key, value string)
}

var sink atomic.Int64

// worker times every operation and stores the durations in lat.
func worker(c cache, keys []string, lat []int64, readPct int, seed uint64, wg *sync.WaitGroup) {
	defer wg.Done()
	rng := rand.New(rand.NewPCG(seed, seed))
	found := 0
	for i := range lat {
		key := keys[rng.IntN(len(keys))]
		read := rng.IntN(100) < readPct
		start := time.Now()
		if read {
			if v, ok := c.Get(key); ok {
				found += len(v)
			}
		} else {
			c.Put(key, "updated")
		}
		lat[i] = int64(time.Since(start))
	}
	sink.Add(int64(found))
}

func run(c cache, keys []string, readPct, nGoroutines int) []int64 {
	for _, key := range keys {
		c.Put(key, "initial")
	}
	ops := totalOps / nGoroutines
	all := make([]int64, ops*nGoroutines)
	runtime.GC()
	var wg sync.WaitGroup
	for i := range nGoroutines {
		wg.Add(1)
		go worker(c, keys, all[i*ops:(i+1)*ops], readPct, uint64(i+1), &wg)
	}
	wg.Wait()
	return all
}

func pct(sorted []int64, p float64) int64 {
	i := int(p / 100 * float64(len(sorted)-1))
	return sorted[i]
}

func main() {
	if len(os.Args) != 5 && len(os.Args) != 6 {
		fmt.Fprintln(os.Stderr, "usage: tails <mutex|rwlock> <shards> <read_pct> <goroutines> [procs]")
		os.Exit(1)
	}
	design := os.Args[1]
	shards, _ := strconv.Atoi(os.Args[2])
	readPct, _ := strconv.Atoi(os.Args[3])
	nGoroutines, _ := strconv.Atoi(os.Args[4])
	procs := nGoroutines
	if len(os.Args) == 6 {
		procs, _ = strconv.Atoi(os.Args[5])
	}
	runtime.GOMAXPROCS(procs)

	keys := make([]string, nKeys)
	for i := range keys {
		keys[i] = "key-" + strconv.Itoa(i)
	}

	var c cache
	switch design {
	case "mutex":
		c = NewCache[MutexLock](shards)
	case "rwlock":
		c = NewCache[RwLock](shards)
	default:
		fmt.Fprintln(os.Stderr, "unknown design:", design)
		os.Exit(1)
	}

	lat := run(c, keys, readPct, nGoroutines)
	var sum int64
	for _, d := range lat {
		sum += d
	}
	slices.Sort(lat)
	mean := float64(sum) / float64(len(lat))
	fmt.Printf("%s,%d,%d,%d,%.1f,%d,%d,%d,%d,%d\n", design, shards, readPct, nGoroutines,
		mean, pct(lat, 50), pct(lat, 99), pct(lat, 99.9), pct(lat, 99.99), lat[len(lat)-1])
}
The worker() function receives a slice of int64 with one element per operation that it is going to perform. Before each operation it reads the clock with time.Now(), after the operation it reads it again with time.Since() and the difference goes into the slice. The random key and the decision between a read and a write happen before the clock starts, so the random number generator is not part of what I measure. The run() function allocates one slice for all 8 million durations, which is 64 MB, before the goroutines start and gives each goroutine its own part of it, so the goroutines never allocate anything while the clock runs. Just before the goroutines start, the run() function calls runtime.GC(). I added this call after a run with GODEBUG=gctrace=1 showed that the 64 MB allocation started a Garbage Collector cycle at the same moment as the goroutines. With 8 goroutines this changed only the maximum but with 1024 goroutines it changed the mean and the tail of every run from 256 shards on. As the runtime.GC() call runs a full cycle before the clock starts and the measurement does not allocate enough memory to start another one, the Garbage Collector now stays out of the measurement.
When the goroutines are done, the main() function adds all durations for the mean, sorts the slice and picks the percentiles out of it with the pct() function. The pct() function multiplies the percentile by the length of the slice minus one and uses the result as the index, so the p99 of 8 million values is the value at index 7,919,999. Sorting 8 million integers takes a fraction of a second, which is fine because it happens after the clock has stopped. The output is one CSV line with the design, the shard count, the read percentage, the goroutine count, the mean, the p50, the p99, the p99.9, the p99.99 and the maximum, all in nanoseconds.
Clock overhead and resolution Link to heading
As the program reads the clock 16 million times inside a loop of 300 ns operations, I measured what reading it costs. A call to time.Now() followed by a call to time.Since() takes 45 ns on my Mac but only part of that falls between the two readings of the clock. When I time an empty block of code, two thirds of the measurements are 0 ns and the average is 14 ns, which is the clock overhead in each measurement of this post. The overhead is the same for every design and every shard count, so it changes none of the comparisons. The full 45 ns is added to every iteration of the loop, though, so you should not compare the numbers here with the numbers of the throughput post without taking it into account.
The monotonic clock on Apple Silicon ticks 24 million times per second, so the smallest difference between two readings is 41.67 ns. Every duration in the results is a multiple of that. The p50 column of the table below says 250, 333 and 500, which are 6, 8 and 12 ticks. For the tail, which is in the microseconds, this does not matter but for the median it does, as a difference of one tick between two shard counts is not a real difference.
I timed every operation instead of a sample because the tail consists of rare events. With 8 million measurements the p99.99 is about the 800th slowest operation. If I had timed one operation in a hundred, it would have been about the 8th slowest, which is too few for a stable number.
How I measured Link to heading
The setup is the one from the throughput post. There are one million keys, from key-0 to key-999999, all inserted before the clock starts. I used the balanced workload, where half of the operations are reads and half are writes. Every goroutine calls the cache in a tight loop and does nothing else, which is the worst case for collisions. A real server does other work between two cache calls, so its goroutines meet less often and fewer operations have to wait for a lock than in this post. For the same percentile it probably needs fewer shards than the numbers here suggest. The design is the mutex per shard one, which the throughput post picked as the best choice. The program sets GOMAXPROCS to the number of goroutines, so 8 goroutines run on 8 cores. I ran the cache with 1, 16, 64, 256, 1024, 4096 and 16384 shards, where one shard is the single mutex design and every step from 16 shards on multiplies the shard count by four. The tables show the median of each column across 5 runs of every combination, so the p99 in a cell is the median of 5 p99 values. The machine is a Mac with an Apple M4 Pro CPU running Go 1.27.3.
Save the program as tails.go in its own directory and run it like this:
$ go mod init tails
$ go build -o tails .
$ ./tails mutex 1 50 8
mutex,1,50,8,3031.8,500,32000,57542,89208,1105750
$ ./tails mutex 256 50 8
mutex,256,50,8,286.0,250,584,1041,18167,238333
The two commands differ only in the number of shards. The mean drops from 3.0 µs to 286 ns, about a factor of ten, which is close to what the throughput post measured. The p99.9 drops from 58 µs to 1.0 µs, a factor of 55. These are single runs, so they can differ a lot from the medians of five runs in the tables below, especially in the tail.
The results Link to heading
The plot shows the four percentiles against the shard count, with 8 goroutines on 8 cores. The y axis is logarithmic because the top left of the plot is in the tens of microseconds and the bottom right is in the hundreds of nanoseconds.
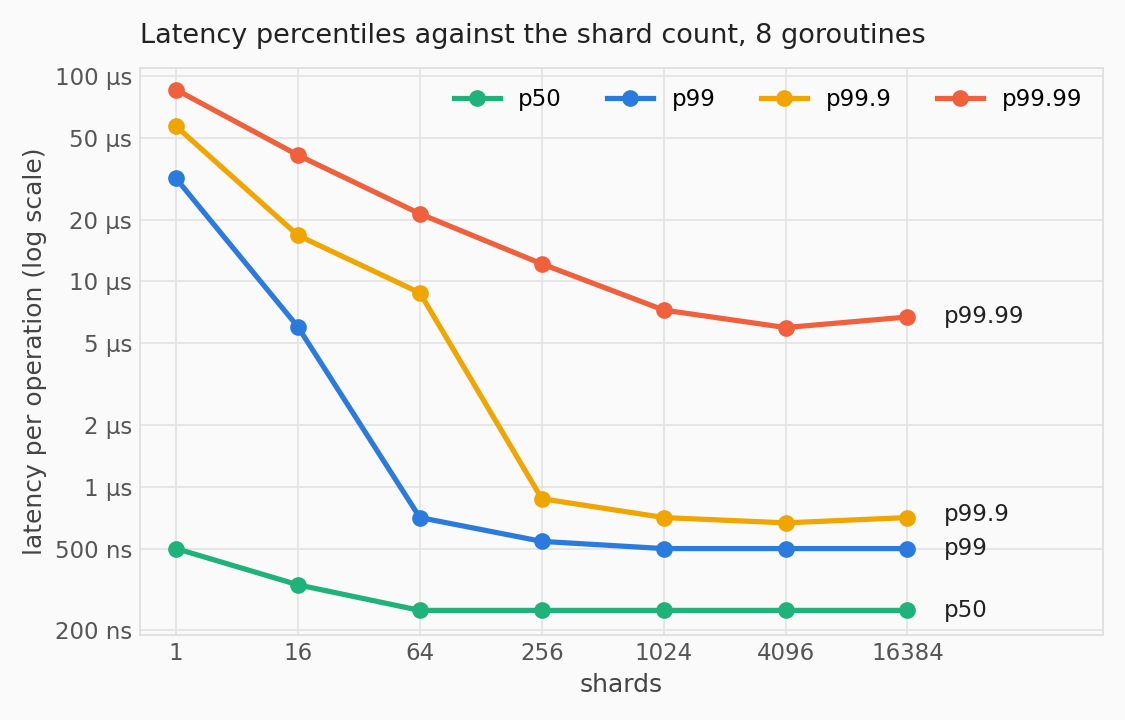
This is the table behind the plot, with the mean and the maximum added. All values are in nanoseconds and lower is better.
| shards | mean | p50 | p99 | p99.9 | p99.99 | max |
|---|---|---|---|---|---|---|
| 1 | 3030 | 500 | 31708 | 56917 | 85750 | 250125 |
| 16 | 492 | 333 | 6000 | 16750 | 41167 | 122084 |
| 64 | 311 | 250 | 708 | 8791 | 21333 | 118916 |
| 256 | 266 | 250 | 542 | 875 | 12167 | 110208 |
| 1024 | 252 | 250 | 500 | 708 | 7250 | 81500 |
| 4096 | 248 | 250 | 500 | 667 | 5959 | 111625 |
| 16384 | 261 | 250 | 500 | 708 | 6708 | 145083 |
The p50 column hardly moves. From 64 shards on the median operation costs 250 ns, which is the clock overhead, the lock and a lookup in a map of one million entries that misses the CPU caches. With 16 shards it costs two ticks more. If an operation does not collide with another goroutine, the number of shards makes almost no difference to it because it only touches one shard. With one shard the median is 500 ns because with one mutex and 8 goroutines even the median operation waits for someone.
With 64 shards the p99 is already down to 708 ns, which is 11 ticks above the median. A goroutine that waits on a sync.Mutex first spins, which means that it checks the lock a few times in a short loop while it keeps its core. If the lock is still taken after that, the goroutine parks, which means that it goes to sleep, gives its core to another goroutine and only runs again after the lock is released and the scheduler wakes it up. The p99 operation had to wait a little for its shard without parking, most likely by spinning while the other goroutine finished. From 256 shards on the p99 is 500 to 542 ns, 6 or 7 ticks above the median. A run with a single goroutine, which never waits for a lock, has its p99 5 ticks above its median, so most of these extra ticks come from the lookup and not from the locks.
The p99.9 column is the most important one. With 64 shards one operation in a thousand costs 8.8 µs, which is too long for a spin. It comes from a goroutine that found its shard locked, spun without getting the lock, parked itself and was woken up by the scheduler when the lock was released. Parking and waking up go through the Go runtime, which costs a few microseconds on my Mac. With 256 shards the p99.9 is 875 ns, so fewer than one operation in a thousand parks. In this table the step from 64 to 256 shards makes the p99.9 ten times smaller, while the mean only goes down by 15 percent.
The p99.99 column falls more slowly. In the table it goes from 21 µs with 64 shards to 12 µs with 256 and from 1024 shards on it stays at about 6 to 7 µs. Since the shard count no longer changes it, those 6 to 7 µs are not about the locks. This floor of 6 to 7 µs also varies a lot between runs and was between 1 µs and 3 µs in other sessions, so it depends on what else the machine is doing.
A meeting is when two goroutines use the same shard at the same moment, which is the only way a goroutine can end up waiting for a lock. With 8 goroutines, each of the other 7 goroutines is in your shard with a chance of one divided by the number of shards, so the chance of a meeting is roughly 7 divided by the number of shards, which is one in nine at 64 shards, one in 37 at 256 and one in 146 at 1024. Not every meeting ends in a park because the lock is only held for part of the operation and spinning often wins. As the shards go up, the meetings get rarer and so do the parks, which leave the p99 between 16 and 64 shards and then leave the p99.9 between 64 and 256 shards. Near the end of this post I count the parks to check this.
The mean column is the closest thing in this post to what the throughput post measured. It goes from 311 ns at 64 shards to 252 ns at 1024, a drop of 19 percent, while the p99.9 drops by a factor of twelve.
I included the max column to show that it is mostly noise. Every maximum in the table is between 80 µs and 250 µs without following the shard count, although single runs still reach 1.5 ms. In the first version of this table, before I added the runtime.GC() call, the maximums were between 0.3 ms and 3.8 ms because the Garbage Collector was running during the first milliseconds of every run. With 8 million timed operations the slowest one most likely comes from the Operating System, for example when it moves a thread to another core or runs something else on it.
The locality question Link to heading
The reader’s worry was that too many shards hurt cache locality. The idea is that every shard is a separate piece of memory with its own lock and its own map and that spreading the work over thousands of them touches more cache lines than keeping it in a few. In the table the numbers for 1024 and 4096 shards are the same within the noise, while the mean with 16384 shards is about 10 ns higher. To find out whether those 10 ns are real, I ran 256, 1024, 4096 and 16384 shards five times each, taking turns so that all four saw the same state of the machine. I did that with 8 goroutines and with a single goroutine, which never waits for a lock.
With 8 goroutines the mean was 243 ns with 1024 shards, 241 ns with 4096 and 254 ns with 16384. With a single goroutine it was 207 to 211 ns from 256 to 4096 shards and 237 ns with 16384. Every run with a single goroutine and 16384 shards was slower than all the other runs with a single goroutine. This means that locality does cost something at 16384 shards, about 5 percent of the mean with 8 goroutines and about 12 percent with a single goroutine. I did not look into why the step to 16384 shards costs something.
Up to 4096 shards locality made no difference that I could measure because the maps are already too big to be cached. The shard array is 128 bytes per shard, so 512 KB at 4096 shards, which fits in the L2 cache of the M4 Pro. The one million entries of the maps take tens of megabytes no matter how they are split, so every lookup goes to memory for the group of slots that holds its key. Since every lookup already misses the cache, a bigger shard array adds little. The 120 ns that a lookup costs in the throughput post is the cost of that memory access.
Locality would matter with a small map because with 16000 entries the whole cache fits in L2 and a lookup costs 13 ns instead of 120, as I measured in the throughput post. In that case every operation also touches its shard and the map header. With 64 shards the shards take 8 KB and stay in L1, while 16384 shards take 2 MB and do not. I did not measure that case because the point of the benchmark is a cache with a lot of data in it, although that is where the worry is justified.
With this much data many shards do not cost much memory because one million entries need about the same storage however they are split, so the whole cache takes about 84 MB with 1, 64 or 1024 shards, 76 MB with 4096 and 83 MB with 16384. With a thousand entries, however, the cache takes 94 KB with 64 shards and 3.2 MB with 16384 because every shard has its own 128 bytes and its own map, even when the map is almost empty.
More goroutines than cores Link to heading
As a real server runs thousands of goroutines and the throughput post already has a plot where 8 to 1024 goroutines share 8 cores, I ran the shard sweep again with 1024 goroutines. The optional fifth argument of the program sets GOMAXPROCS on its own, so ./tails mutex 64 50 1024 8 runs 1024 goroutines on 8 cores. These numbers are harder to read, so I explain what they measure before I show them.
With 1024 goroutines on 8 cores, a goroutine that parks on a lock does not get the CPU back as soon as the lock is released. The runtime puts it first in line on the core that released the lock but that core keeps running the goroutine that released the lock until that goroutine blocks or uses up its time slice of 10 ms. If another goroutine is woken up on the same core in the meantime, it takes the first place and pushes the earlier one to the back of a queue that often has more than a hundred goroutines in it, which means that a park that cost a few microseconds with 8 goroutines can now take milliseconds. The same is true of any other reason to lose the CPU while the clock runs, including a goroutine that is preempted while it holds a lock, which keeps its shard locked until it runs again. The goroutines also almost never spin because a goroutine that waits on a sync.Mutex only spins when no other goroutine is waiting to run on its core, which is almost never the case with 1024 goroutines. As a result, almost every goroutine that finds its shard locked parks right away. The clock keeps ticking while a goroutine waits, so the measurement is the latency that a caller would see, which depends on the scheduler as much as on the locks.
The plot shows the same four percentiles for 1024 goroutines on 8 cores, on a y axis that now goes from 200 ns to 100 ms.
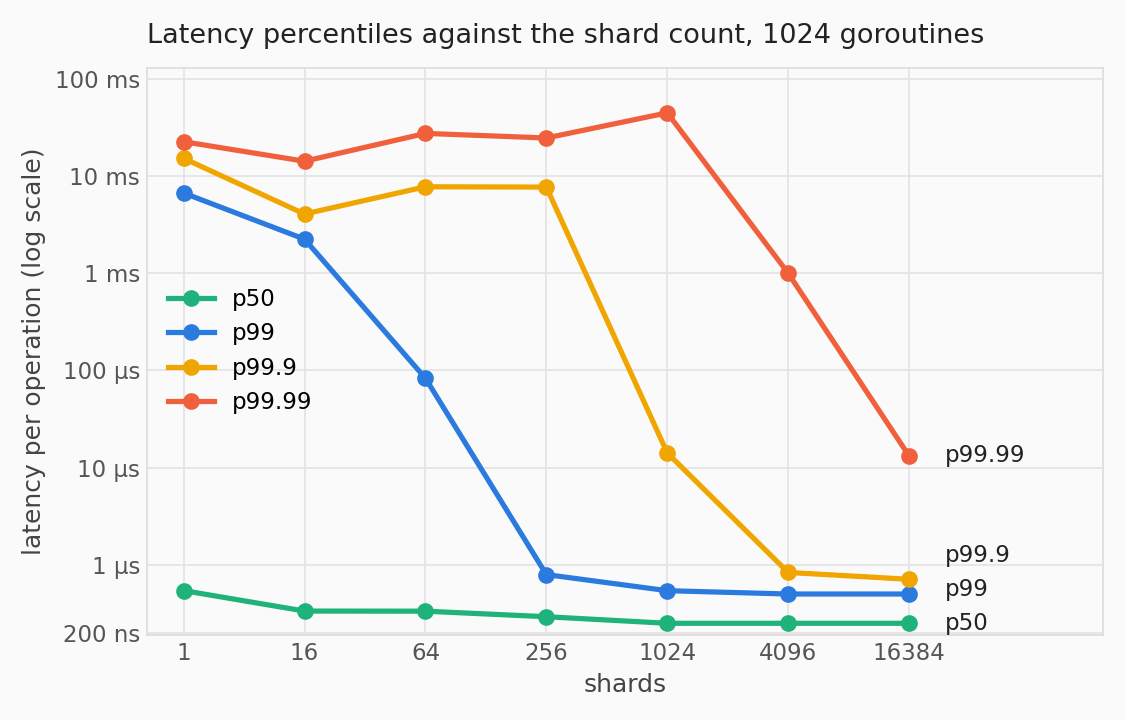
This is the table behind the plot, with the mean added.
| shards | mean | p50 | p99 | p99.9 | p99.99 |
|---|---|---|---|---|---|
| 1 | 435044 | 542 | 6653583 | 15114875 | 22431209 |
| 16 | 63498 | 334 | 2230000 | 4046500 | 14128542 |
| 64 | 44541 | 333 | 82750 | 7713791 | 27295291 |
| 256 | 19610 | 292 | 792 | 7656833 | 24489458 |
| 1024 | 13346 | 250 | 541 | 14125 | 44447791 |
| 4096 | 4841 | 250 | 500 | 833 | 997083 |
| 16384 | 758 | 250 | 500 | 709 | 13167 |
The p50 column is within two ticks of the 8 goroutine table. Apart from the single mutex, the median operation still does not meet another goroutine and costs one map lookup.
The single mutex is by far the slowest. Its mean is 435044 ns, or 435 µs per operation, which is about 140 times the 8 goroutine case. The p99 is 6.7 ms. The median is still 542 ns, so most operations get the lock quickly but at least one in a hundred waits for milliseconds. With a thousand goroutines on one lock, the mutex also switches to starvation mode whenever a waiter has waited for more than 1 ms. In that mode the Unlock() method hands the lock straight to the next waiter and sends the goroutine that unlocked it to the back of its run queue, so an operation can wait for milliseconds without ever parking. The throughput post measured 412 ns per operation for this case. The cache does complete an operation every 412 ns but the average caller waits almost half a millisecond for its own.
Every percentile above the median needs more shards than with 8 goroutines. The p99 drops below 1 µs at 256 shards instead of 64 and the p99.9 at 4096 shards instead of 256. The p99.99 needs 16384 shards to get down to 13 µs, about twice the 8 goroutine value. The reason is that a goroutine that finds its shard locked now almost always parks and a park can take milliseconds, so with 64 shards the p99.9 is 7.7 ms, about 900 times more than the 8.8 µs of the 8 goroutine case. The mean falls steadily, from 45 µs with 64 shards to 758 ns with 16384. At 16384 shards most of the mean comes from fewer than one operation in ten thousand.
I left out the maximum, which is about 30 ms to 270 ms. With 4096 and 16384 shards it is close to the length of the whole run, about 0.3 seconds, so at least one goroutine lost the CPU in the middle of an operation and only got it back near the end. I did not look into it because this post is about the locks.
Counting the parks Link to heading
So far I have explained the slow operations with goroutines that park on a lock but as the latencies alone do not prove it, I used the block profile of Go to count the parks. After a call to runtime.SetBlockProfileRate(1), the runtime records every time a goroutine blocks, together with the stack of the goroutine. A goroutine that gets its lock while spinning does not block, so it is not recorded. I added a countParks() function to the program, which reads the records with runtime.BlockProfile() and adds up the ones whose stack goes through the Lock() method of sync.Mutex.
// countParks returns how many times a goroutine parked on a sync.Mutex
// since runtime.SetBlockProfileRate(1) was called.
func countParks() int64 {
	var records []runtime.BlockProfileRecord
	n, ok := runtime.BlockProfile(nil)
	for !ok {
		records = make([]runtime.BlockProfileRecord, n+100)
		n, ok = runtime.BlockProfile(records)
	}
	var parks int64
	for _, r := range records[:n] {
		frames := runtime.CallersFrames(r.Stack())
		for {
			f, more := frames.Next()
			if f.Function == "sync.(*Mutex).Lock" {
				parks += r.Count
				break
			}
			if !more {
				break
			}
		}
	}
	return parks
}
In the main() function the call to run() becomes this:
	runtime.SetBlockProfileRate(1)
	lat := run(c, keys, readPct, nGoroutines)
	parks := countParks()
	fmt.Printf("%d parks, %.4f%% of the operations\n", parks, 100*float64(parks)/float64(len(lat)))
Recording a park makes the park slower, so I ran this version separately from the timing runs. As one operation can park more than once because a goroutine that is woken up can lose the lock to another goroutine and park again, the table shows parks per 100 operations, as the median of 3 runs. I also counted the operations that took longer than 2 µs in the same runs.
| shards | parks, 8 goroutines | over 2 µs, 8 goroutines | parks, 1024 goroutines | over 2 µs, 1024 goroutines |
|---|---|---|---|---|
| 1 | 24 | 21% | 28 | 32% |
| 16 | 1.8 | 1.8% | 6.2 | 6.3% |
| 64 | 0.18 | 0.19% | 1.7 | 1.7% |
| 256 | 0.027 | 0.031% | 0.50 | 0.50% |
| 1024 | 0.0040 | 0.010% | 0.11 | 0.12% |
| 4096 | 0.00086 | 0.0085% | 0.020 | 0.027% |
| 16384 | 0.00016 | 0.0091% | 0.0043 | 0.011% |
The two counts agree wherever the locks are busy. With 8 goroutines and 64 shards there are 0.18 parks per 100 operations and 0.19 percent of the operations take longer than 2 µs, which is what you would expect if nearly every slow operation is a park. That is more than one in a thousand and less than one in a hundred, so the p99.9 lands on a park and the p99 does not. Across all my runs with 64 shards there were between 0.10 and 0.19 parks per 100 operations, so the p99.9 sits right at the edge of the parks. With 256 shards there are 0.027 parks per 100 operations, so the parks leave the p99.9 but stay in the p99.99. From 1024 shards on the parks drop to about 320 per run and then to about a dozen, while about 700 to 800 operations per run still take longer than 2 µs. Those are the same kind of slow operations that make the p99.99 floor and they have nothing to do with the locks.
The parks also get rarer faster than the meetings. Every step multiplies the shard count by four but between 16 and 256 shards the parks get rarer by a factor of about seven to ten at every step. One possible reason is that spinning wins more often when fewer goroutines compete for the same shard.
With 1024 goroutines there are many more parks. From 64 to 1024 shards there are 9 to 28 times more than with 8 goroutines and the same number of shards. This is partly because the goroutines no longer spin and partly because a goroutine can lose the CPU while it holds a lock, which keeps its shard locked for longer. With 64 shards there are 1.7 parks per 100 operations, which puts a park on the p99. With a single shard every run has about 300,000 more slow operations than parks. Those are most likely operations that waited in the run queue after an Unlock() in starvation mode, without parking.
Conclusions Link to heading
- The shard count matters much more for the tail latency than for the throughput. Between 64 and 1024 shards the mean moves by 19 percent, while the p99.9 drops by a factor of twelve.
- Every time I multiplied the shard count by four, the operations that park on a lock moved further into the tail. With 8 goroutines they left the p99 at 64 shards and the p99.9 at 256. I would pick the shard count from the percentile I care about instead of the mean.
- 256 shards keep the parked goroutines out of the p99.9 with 8 goroutines but with 1024 goroutines on 8 cores it takes 4096 shards because the goroutines almost never spin and a parked goroutine has to wait for the scheduler after it is woken up.
- Because the maps miss the cache on every lookup anyway, cache locality made no difference that I could measure until 16384 shards, where the mean went up by about 5 percent. It would cost more with a map small enough to be cached, which is a different benchmark.
- With millions of samples the maximum measures the Operating System and the scheduler more than the locks.
- A large allocation just before the clock starts can start a Garbage Collector cycle in the middle of the measurement. Calling
runtime.GC()first avoids it. - The block profile can count the parks on a lock, which is a good way to check what the percentiles seem to say.
Timing every operation was the cheapest experiment of this series but it changed how I read the throughput post more than any other. The throughput plot said that 256 shards were 27 percent faster than 64, while the tail shows that with 64 shards more than one operation in a thousand parks and takes about 9 µs, against two or three in ten thousand with 256 shards.
You can purchase Practical Systems Programming in Go from amazon.com or Packt Publishing. All code from the book is available in the official GitHub repository.